
|
odishageography.com |
Human Development in Odisha
Human development is the process of enlarging people’s choices — to lead a long and healthy life, to be educated, and to enjoy a decent standard of living. The idea, developed by economist Mahbub ul Haq and Nobel laureate Amartya Sen, was made measurable through the Human Development Index (HDI) in the first UNDP Human Development Report (1990). The HDI combines three dimensions — health (life expectancy at birth), education (mean and expected years of schooling) and income (per capita income) — into a single value between 0 and 1.
Odisha’s human development story is one of the most striking turnarounds among Indian states. In the early 1990s it was among the poorest states in India: its HDI was about 0.40, more than half its people lived below the poverty line, and its infant and maternal mortality rates were among the highest in the country. Three decades later, Odisha has:
- raised its HDI by about half, from 0.403 in 1990 to 0.610 in 2022 (Global Data Lab);
- cut multidimensional poverty from 63.8% (2005–06) to 15.7% (2019–21), freeing over one crore people from deprivation;
- brought its life expectancy (70.3 years) and total fertility rate (1.8) to or better than the national average;
- become a national model for disaster management, women’s self-help groups (Mission Shakti) and public food distribution.
Yet Odisha still sits in the lower part of India’s HDI ranking. Persistent challenges include high infant and maternal mortality, child undernutrition and anaemia, low higher-education enrolment, and a deep regional divide between the developed coastal and mining districts and the tribal-dominated south and west, especially the KBK (Kalahandi–Balangir–Koraput) region. Understanding this mix of progress and gaps is central to the geography of development in Odisha.
Table of Contents
Human Development Index of Odisha
Odisha Human Development Report, 2004
Odisha (then Orissa) was among the first Indian states to publish its own human development report. The Orissa Human Development Report 2004, prepared by the Planning and Coordination Department with UNDP support, estimated the state’s HDI at 0.579 — the state’s HDI having risen about 51% between 1981 and 2001, though Odisha remained the fifth-lowest among major states. It also put the Gender Development Index (GDI) at 0.539.
The report calculated HDI for all 30 districts and revealed a sharp spatial divide:
| Rank | Highest-HDI districts | HDI | Lowest-HDI districts | HDI |
|---|---|---|---|---|
| 1 | Khurda | 0.736 | Malkangiri | 0.370 |
| 2 | Jharsuguda | 0.722 | Kandhamal | 0.389 |
| 3 | Cuttack | 0.695 | Gajapati | 0.431 |
| 4 | Sundargarh | 0.683 | Koraput | 0.431 |
| 5 | Angul | 0.663 | Nabarangpur | 0.436 |
The most developed districts are urban–industrial (Khurda with Bhubaneswar, Cuttack) or mining–industrial (Jharsuguda, Sundargarh, Angul). The least developed form one contiguous belt in the south and south-west, in the Eastern Ghats, where Scheduled Tribes form a large share of the population. The HDI of Khurda was about twice that of Malkangiri.
Odisha’s HDI over time
The Global Data Lab (Radboud University) estimates subnational HDI for Indian states using UNDP methodology. Its series shows Odisha’s HDI rising steadily from 0.403 in 1990 to 0.451 in 2000, 0.527 in 2010, 0.578 in 2015 and 0.614 in 2020, before dipping to 0.598 in 2021 with the COVID-19 pandemic and recovering to 0.610 in 2022. Throughout, Odisha has stayed below the all-India HDI (0.644 in 2022), but the gap has narrowed slightly in relative terms.
In Global Data Lab’s latest (2023) release, Odisha’s HDI is 0.648 against India’s 0.685, placing Odisha 34th of 36 states and union territories — ahead of only Jharkhand and Bihar, and level with Uttar Pradesh. This places Odisha in the medium human development category.
A 2026 study by the National Institute of Public Finance and Policy (NIPFP) on HDI of Indian states for 2022–23 likewise groups Odisha among the states below the national average, with Assam, Rajasthan and West Bengal, and notes that Odisha’s HDI scores resemble those of countries such as Kenya, Ghana and Namibia.
Odisha and India: HDI Trend, 1990–2022
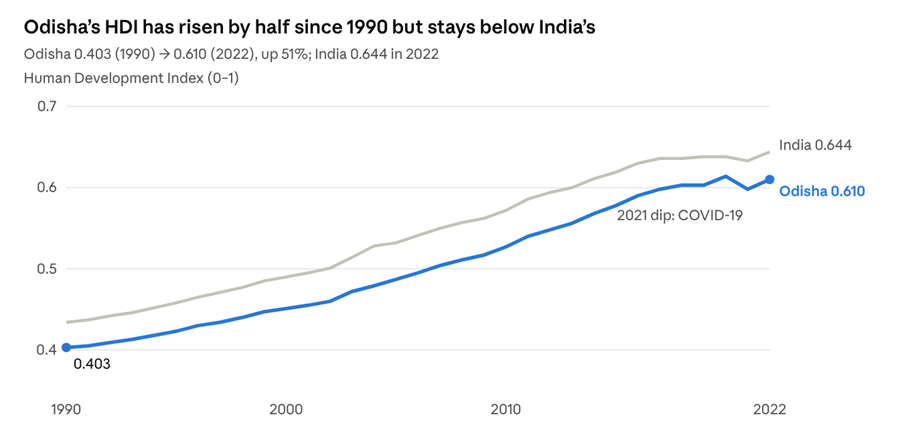
Odisha’s HDI has tracked India’s closely in shape, but a consistent gap of roughly 0.03–0.05 points has remained. The fastest gains came after the mid-2000s, when improvements in schooling, a sharp fall in poverty and higher state spending on health and social protection lifted all three components of the index. The dip in 2021 reflects the COVID-19 shock to life expectancy and incomes, which hit Odisha (like all states) hard.
Poverty and Multidimensional Poverty
Income poverty
Odisha historically had one of the highest poverty rates in India. By the Planning Commission’s Tendulkar methodology, poverty in Odisha fell from 57.2% in 2004–05 to 32.6% in 2011–12, the steepest fall among major states over that period, though it remained well above the national rate of 21.9%. Rural poverty (35.7% in 2011–12) was far higher than urban poverty (17.3%). No official state-level income poverty estimate has been released since 2011–12.
Multidimensional Poverty Index (MPI)
NITI Aayog’s National Multidimensional Poverty Index measures deprivation across 12 indicators of health (nutrition, child and adolescent mortality, maternal health), education (years of schooling, school attendance) and standard of living (cooking fuel, sanitation, drinking water, electricity, housing, assets, bank account), using National Family Health Survey (NFHS) data.
| Period | Share of Odisha’s population multidimensionally poor | India |
|---|---|---|
| 2005–06 (NFHS-3) | 63.84% | about 55% |
| 2015–16 (NFHS-4) | 29.34% | 24.85% |
| 2019–21 (NFHS-5) | 15.68% | 14.96% |
| 2022–23 (NITI projection) | 11.07% | 11.28% |
Between 2005–06 and 2019–21, over one crore people in Odisha moved out of multidimensional poverty. NITI Aayog named Odisha among the five states with the fastest decline in the share of multidimensionally poor between 2015–16 and 2019–21, alongside Uttar Pradesh, Bihar, Madhya Pradesh and Rajasthan.
District pattern
Poverty is heavily concentrated in the tribal south and south-west. In the MPI baseline (NFHS-4), the highest shares of multidimensionally poor were in Nabarangpur (59.3%), Malkangiri (58.7%) and Koraput (51.1%), while Puri and the coastal districts had the lowest. The largest deprivations statewide were in nutrition, cooking fuel, housing and sanitation.
Health
Health is the dimension in which Odisha has made some of its biggest gains, yet it still lags the national average on several key outcomes.
| Indicator | Odisha | India | Source / year |
|---|---|---|---|
| Life expectancy at birth | 70.3 years | 70.0 years | SRS abridged life tables, 2016–20 |
| Infant mortality rate (per 1,000 live births) | 36 | 28 | SRS 2020 |
| Maternal mortality ratio (per 1,00,000 live births) | 135 | 93 | SRS 2019–21 |
| Total fertility rate | 1.8 | 2.0 | NFHS-5, 2019–21 |
| Institutional births | 92.2% | 88.6% | NFHS-5 |
| Children 12–23 months fully immunised | 90.5% | 76.4% | NFHS-5 |
| Children under 5 stunted | 31.0% | 35.5% | NFHS-5 |
| Children under 5 underweight | 29.7% | 32.1% | NFHS-5 |
| Women 15–49 anaemic | 64.3% | 57.0% | NFHS-5 |
Progress
- Infant mortality has fallen dramatically — from about 96 per 1,000 in 2000 (then the highest in India) to 36 in 2020.
- Maternal mortality fell by more than 300 points over two decades; Odisha’s MMR was 424 in 1997–98.
- Fertility has dropped below replacement level (TFR 1.8).
- Immunisation (90.5%) and institutional delivery (92.2%) are well above the national average.
Persistent gaps
- IMR and MMR remain among the highest of any state, with MMR in fact rising from 119 (2018–20) to 135 (2019–21), partly reflecting the pandemic.
- Anaemia affects nearly two-thirds of women and children.
- Malaria remains a burden in forested tribal districts, though the DAMaN (Durgama Anchalare Malaria Nirakaran) programme has cut cases sharply since 2017.
- Shortages of doctors and specialists persist in tribal districts.
Key health schemes
- Biju Swasthya Kalyan Yojana (BSKY) (2018) offered free treatment in public hospitals and cashless cover up to ₹5 lakh per family (₹10 lakh for women) in empanelled private hospitals. In 2025 Odisha joined Ayushman Bharat (PM-JAY) under the integrated Ayushman Bharat–Gopabandhu Jan Arogya Yojana.
- Mamata — a state conditional cash transfer for pregnant and lactating women.
- Niramaya (free medicines) and Nidan (free diagnostics) in government hospitals.
- Mukhyamantri Swasthya Seva Mission to upgrade health infrastructure and new medical colleges in districts such as Koraput, Balangir, Baripada and Bhawanipatna.
Education
Literacy
According to Census 2011, Odisha’s literacy rate was 72.87%, close to the national average of 73.0%:
| Census | Total | Male | Female |
|---|---|---|---|
| 1951 | 15.8% | 27.3% | 4.5% |
| 1991 | 49.1% | 63.1% | 34.7% |
| 2001 | 63.1% | 75.4% | 50.5% |
| 2011 | 72.9% | 81.6% | 64.0% |
The male–female gap narrowed from 28 percentage points in 1991 to 18 in 2011. Literacy is highest in the coastal districts — Khordha (86.9%), Jagatsinghpur (86.6%) and Cuttack (85.5%) — and lowest in the tribal south: Nabarangpur (46.4%), Malkangiri (48.5%) and Koraput (49.2%). Female literacy in Malkangiri and Nabarangpur was below 40%. Scheduled Tribe literacy in the state was only 52.2%.
School and higher education
- Elementary enrolment is almost universal, helped by free textbooks, uniforms, mid-day meals (PM POSHAN), free bicycles for Class IX students and residential schools for tribal children run by the ST & SC Development Department.
- Dropouts remain a problem: the SDG India Index 2023–24 reported a secondary-level dropout rate of 27.3%, among the highest in India, which pulled Odisha’s score on SDG 4 (Quality Education) down to 40.
- Higher education: the Gross Enrolment Ratio (18–23 years) was 20.7% in 2020–21, below the national 27.3%.
- Learning quality: surveys such as ASER and the National Achievement Survey show that many children in the early grades cannot read or do arithmetic at grade level, especially in tribal areas where the home language (Santali, Kui, Desia, Ho and others) differs from the school language. Odisha’s Multilingual Education (MLE) programme teaches in tribal mother tongues in the early grades.
Reforms
- 5T / Mo School transformation of government high schools with smart classrooms, libraries and labs (2021 onwards), and the Mo School alumni-connect programme.
- Odisha Adarsha Vidyalayas — English-medium CBSE model schools in every block.
- Expansion of universities and institutions of national importance (IIT Bhubaneswar, NISER, AIIMS Bhubaneswar, IIM Sambalpur, Central University of Odisha at Koraput).
Income, Livelihoods, Gender and Regional Disparities
Income and livelihoods
Odisha’s economy has grown faster than India’s for over a decade — real GSDP grew at an average 6.6% a year between 2012–13 and 2021–22, compared with 5.6% nationally (NITI Aayog). Yet per capita income still trails: Odisha’s nominal per capita GSDP was ₹1,46,273 in 2021–22, about 0.85 times India’s ₹1,71,498. Growth has been driven by mining, metals and power, which create relatively few jobs, while about half the workforce remains in agriculture, much of it rain-fed and low-productivity. Large numbers of workers from western and southern Odisha migrate seasonally to brick kilns, construction sites and factories in other states.
Gender
- Sex ratio (Census 2011): 979 females per 1,000 males, better than India’s 943; the child sex ratio (0–6) was 941.
- Female literacy rose from 4.5% in 1951 to 64.0% in 2011.
- The Orissa HDR 2004 estimated the Gender Development Index at 0.539, below the HDI — a sign that women share less in human development.
- Women’s work and pay remain unequal: the SDG India Index 2023–24 gave Odisha a score of only 39 on SDG 5 (Gender Equality), citing a female-to-male wage ratio of 0.59.
- Mission Shakti (2001) has organised about 70 lakh women into roughly 6 lakh self-help groups, one of the largest women’s collective movements in India; the Subhadra Yojana (2024) provides ₹50,000 over five years to eligible women aged 21–60.
Scheduled Tribes and Scheduled Castes
Scheduled Tribes form 22.8% and Scheduled Castes 17.1% of Odisha’s population (Census 2011). Odisha has 62 tribal communities, including 13 Particularly Vulnerable Tribal Groups (PVTGs) such as the Bonda, Dongria Kondh, Juang and Lanjia Saura. ST households lag on almost every human development indicator — literacy, nutrition, maternal health and income — and account for a disproportionate share of the multidimensionally poor.
Regional disparities
Odisha’s human development map has a clear coast–interior divide:
| Region | Character | Human development |
|---|---|---|
| Coastal plains (Khordha, Cuttack, Puri, Jagatsinghpur, Kendrapara, Balasore) | Dense population, irrigated agriculture, cities | Highest literacy and HDI, lowest poverty |
| Northern mining–industrial belt (Sundargarh, Jharsuguda, Angul, Keonjhar) | Mines, steel, aluminium, power | High income and HDI in towns, but tribal interiors lag |
| Western Odisha (Sambalpur, Bargarh, Balangir, Nuapada, Kalahandi) | Plateaus, Hirakud command, drought-prone uplands | Mixed; drought and distress migration in Balangir and Nuapada |
| Southern tribal belt (Koraput, Malkangiri, Nabarangpur, Rayagada, Kandhamal, Gajapati) | Eastern Ghats, forests, shifting cultivation | Lowest HDI, highest poverty and malnutrition |
The undivided KBK region — now the eight districts of Koraput, Malkangiri, Nabarangpur, Rayagada, Balangir, Subarnapur, Kalahandi and Nuapada — has long been one of the poorest regions in India. It has received special attention through the Revised Long-Term Action Plan (RLTAP) from 1998–99, the KBK+ scheme and, since 2018, the Aspirational Districts Programme, under which ten Odisha districts (Balangir, Dhenkanal, Gajapati, Kalahandi, Kandhamal, Koraput, Malkangiri, Nabarangpur, Nuapada and Rayagada) are monitored.
Government Initiatives, SDG Performance and Challenges
Social protection and welfare
- Food security — Odisha’s public distribution system covers most households under the National Food Security Act, topped up by the state food security scheme; rice at ₹1 per kg was introduced in 2013 and is now free.
- KALIA (2018) — income support to small and marginal farmers and landless agricultural households.
- Madhu Babu Pension Yojana — pensions for the elderly, widows and persons with disabilities.
- Mission Shakti and Subhadra — women’s self-help groups, interest-free loans and direct cash support.
- Disaster resilience — after the 1999 super cyclone, Odisha built the Odisha State Disaster Management Authority and over 800 multipurpose cyclone shelters; deaths in later cyclones such as Phailin (2013) and Fani (2019) were kept to a minimum, protecting lives and livelihoods — itself a human development gain.
- Tribal development — the Odisha PVTG Empowerment and Livelihoods Improvement Programme (OPELIP), residential schools, and forest rights titles under the Forest Rights Act.
SDG India Index
In NITI Aayog’s SDG India Index 2023–24, Odisha’s composite score rose to 66 (from 61 in 2020–21), placing it in the Front Runner category for the first time. It was among the top gainers, with a rise of 15 points since 2018.
| Goal | Score | Status |
|---|---|---|
| SDG 6 – Clean water and sanitation | 88 | Front Runner |
| SDG 15 – Life on land | 85 | Front Runner |
| SDG 7 – Affordable and clean energy | 84 | Front Runner |
| SDG 3 – Good health and well-being | 73 | Front Runner |
| SDG 2 – Zero hunger | 45 | Aspirant |
| SDG 4 – Quality education | 40 | Aspirant |
| SDG 5 – Gender equality | 39 | Aspirant |
Key challenges
- Health outcomes — IMR and MMR remain above the national average, and anaemia and child undernutrition are widespread.
- Learning and higher education — high secondary dropout and low college enrolment limit the education component of HDI.
- Jobless growth — capital-intensive mining and metals growth has not created enough jobs; distress migration from western Odisha continues.
- Regional and social inequality — the southern tribal districts and ST communities remain far behind.
- Climate vulnerability — recurring cyclones, floods, droughts and heat waves threaten livelihoods and erase gains.
- Displacement — mining, dams and industrial projects have displaced many tribal and rural families, with mixed resettlement outcomes.
Conclusion
Odisha has travelled further on human development in the last three decades than almost any other Indian state. A state once synonymous with starvation deaths in Kalahandi and the devastation of the 1999 super cyclone has cut multidimensional poverty by three-quarters, matched the national average on life expectancy and fertility, achieved near-universal immunisation and institutional delivery, and built world-class disaster preparedness. Yet its HDI still sits near the bottom of India’s rankings, held back by high infant and maternal mortality, malnutrition, weak learning outcomes and low incomes. The decisive test for the next decade is the tribal south and drought-prone west: closing the gap between the KBK districts and the coastal plains is the key to Odisha’s human development future.
Quick Facts
| Item | Fact |
|---|---|
| HDI (Global Data Lab, 2022) | 0.610 (India 0.644) |
| HDI (Global Data Lab, 2023 release) | 0.648; rank 34 of 36 |
| HDI (Orissa HDR 2004) | 0.579; GDI 0.539 |
| Highest / lowest HDI district (2004) | Khurda 0.736 / Malkangiri 0.370 |
| Multidimensional poverty | 63.84% (2005–06) → 15.68% (2019–21) |
| Life expectancy | 70.3 years (2016–20) |
| IMR | 36 per 1,000 live births (SRS 2020) |
| MMR | 135 per lakh live births (SRS 2019–21) |
| Literacy (2011) | 72.87% (male 81.6%, female 64.0%) |
| Sex ratio (2011) | 979 |
| SDG India Index 2023–24 | 66, Front Runner |
| Per capita GSDP (2021–22) | ₹1,46,273 |
Sources
- Orissa Human Development Report 2004 — Government of Orissa / UNDP
- List of Indian states and union territories by Human Development Index — Wikipedia (Global Data Lab data)
- Subnational Human Development — Global Data Lab
- Human Development Index of Indian States: 2022–23 — NIPFP Working Paper 442 (2026) and Down To Earth coverage
- Macro and Fiscal Landscape of the State of Odisha — NITI Aayog (2025)
- National Multidimensional Poverty Index 2023 — PIB release
- Odisha MPI trend 2005–06 to 2019–21 — Kalinga TV
- District MPI of Odisha — OdishaBytes
- SRS Special Bulletin on Maternal Mortality 2019–21 — The Tribune
- Odisha in SDG India Index 2023–24 — MyCityLinks
- Census of India 2011; NFHS-5 State Fact Sheet, Odisha (2019–21).
© Odisha Geography · Generated on November 6, 2026